How can a simple visual rule help recover data from scientific charts?
A rule-based axis detector uses pixel counting to locate the structure needed for chart data extraction.
Conceptual illustration of axis detection. The chart and pixels are illustrative.
Study design
The method identifies candidate axis colors, counts pixels, and uses geometric rules to locate chart axes. Axis detection is treated as a component of extracting numerical evidence from chart images.
A chart becomes a grid of candidate pixels.
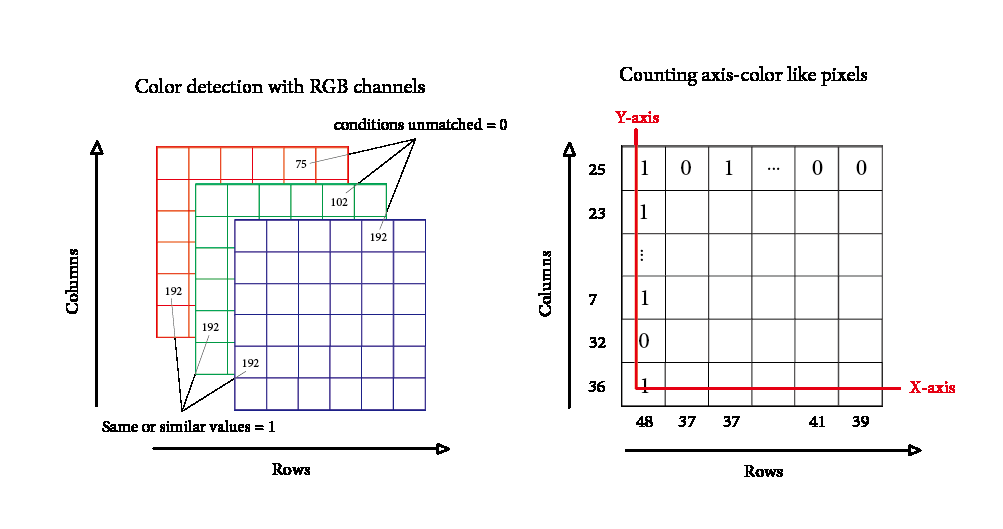
The method uses color thresholds and the spatial arrangement of candidate pixels to find chart axes. This original schematic explains the rule-based procedure; it is not an accuracy plot.
Filter by color
RGB thresholds select pixels that could belong to black or gray chart axes.
Recover the geometry
Counts and location rules across rows and columns identify the axis structure used in later chart extraction.
Lee, Sohn, Ryu & Oh · IEEE IRI 2022 · Figure 2. © 2022 IEEE. Paper ↗
Findings
The paper introduces a lightweight rule-based approach to axis detection, motivated by the need to extract and synthesize information from scientific figures.
The method addresses axis detection within chart extraction. It does not establish an end-to-end system for interpreting arbitrary scientific figures.
Counting Pixels for an Effective Axis Detection
Keeheon Lee, Eury Sohn, Kunhee Ryu, and Seongmin Oh
IEEE IRI 2022 · Published
BibTeX citation
@inproceedings{lee2022pixels,
  title={Counting Pixels for an Effective Axis Detection},
  author={Lee, Keeheon and Sohn, Eury and Ryu, Kunhee and Oh, Seongmin},
  booktitle={IEEE IRI},
  pages={144--145},
  year={2022},
  doi={10.1109/IRI54793.2022.00041}
}